

14-Day Visualization
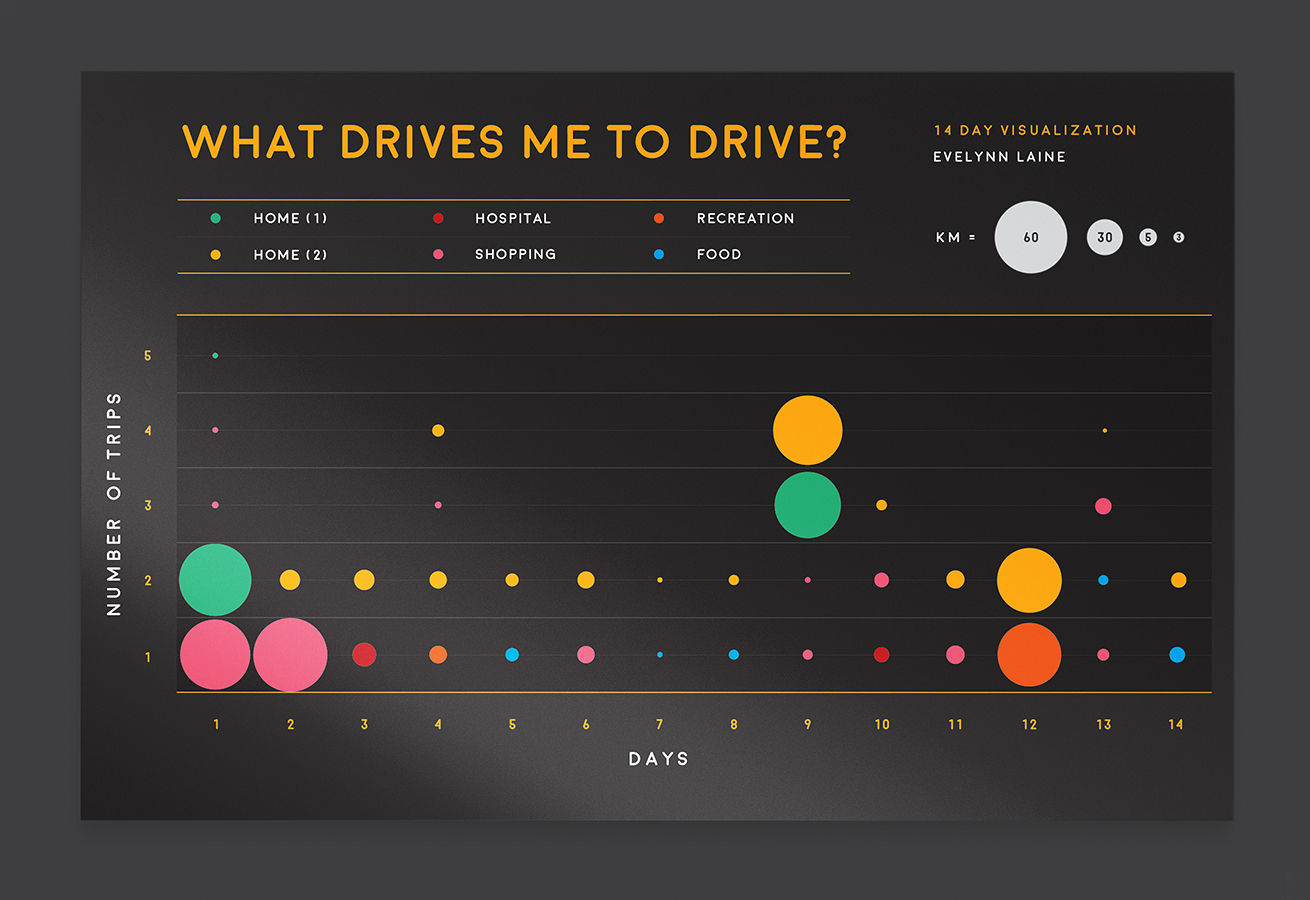
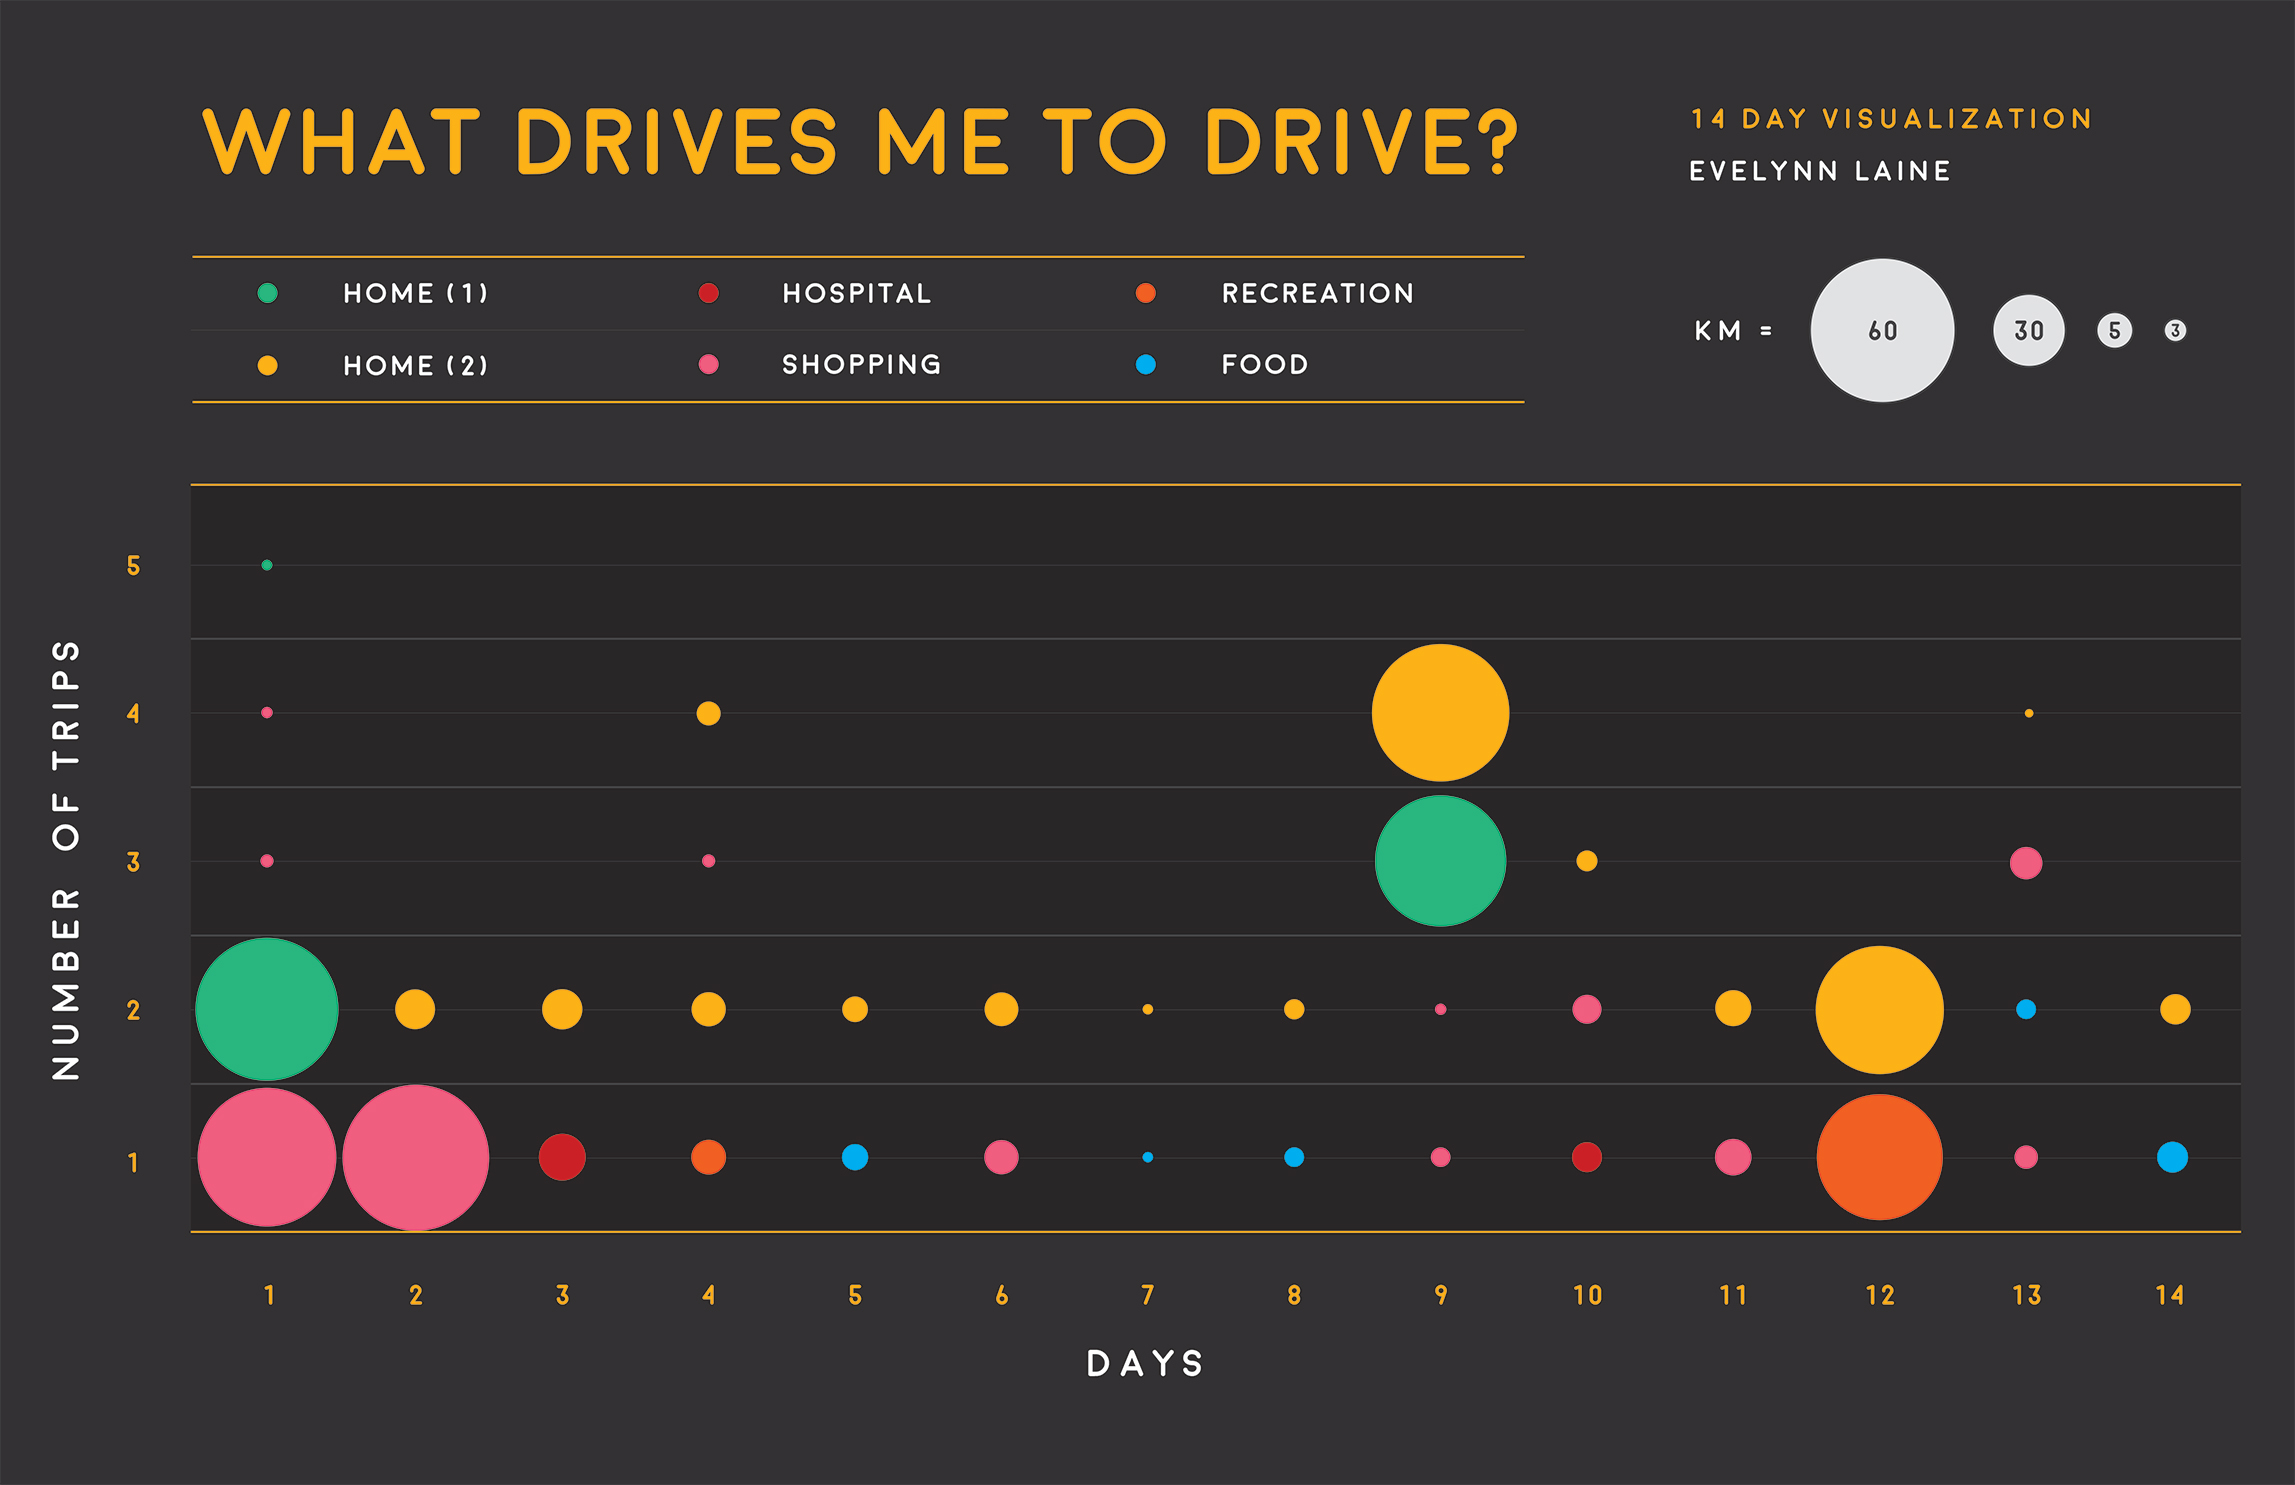
For 14 days I recorded my driving habits, recording the purpose of my trip, length, time, and traffic lights. The challenge of this project was to visualize the data. I trialed different graphs, considering a radial bar graph, stacked bar graph and an area graph. I used the purpose and length of my trips as my variables. It is important to create wireframes of your data to ensure visual impact and readability.

